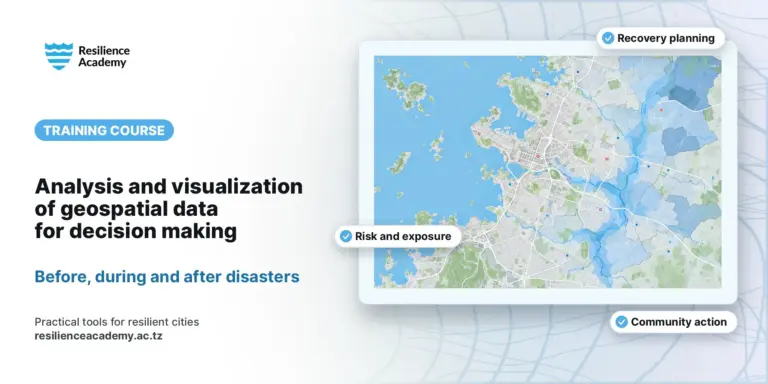
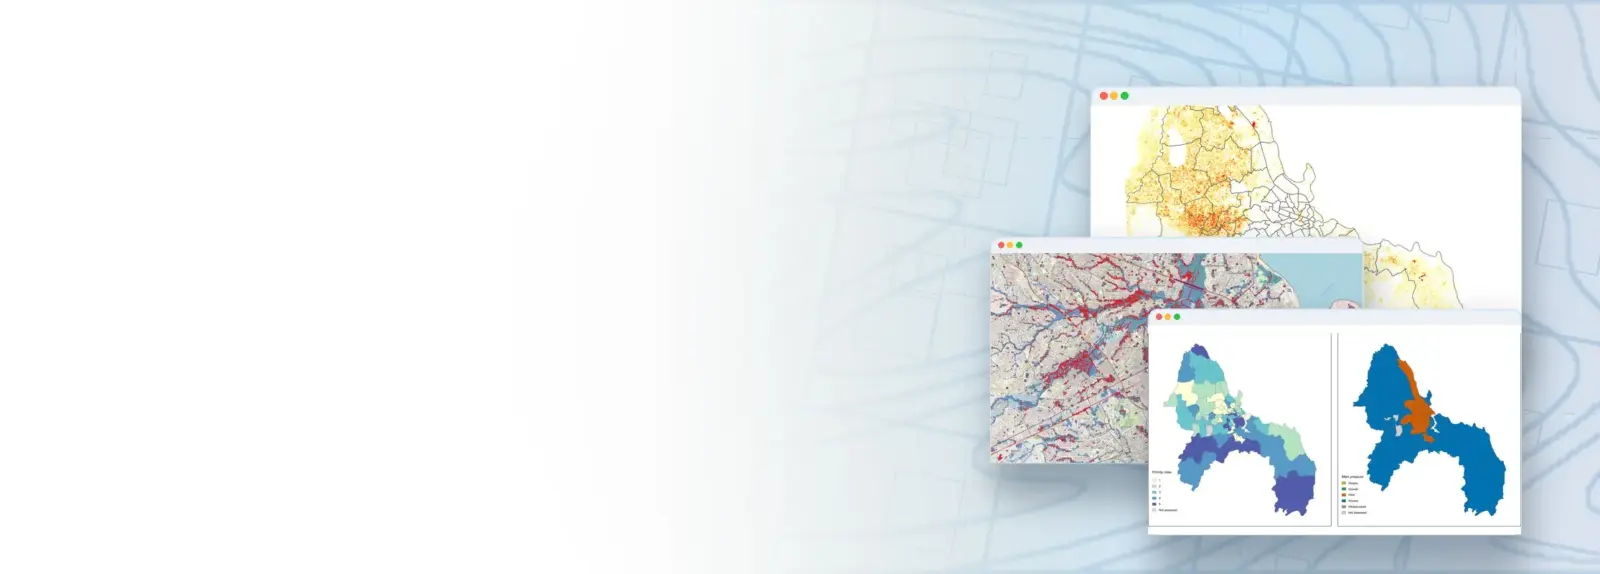
Tanzanian cities face both sudden shocks, such as floods and infrastructure failures, and slow stresses, such as rapid unplanned growth, rising heat and gaps in basic services. This course shows government officials how to understand and measure the resilience of their own city with QGIS, combining local data from the Climate Risk Database (crd.resilienceacademy.ac.tz) with free global datasets: WorldPop population, GHSL built-up surface, Landsat surface temperature and vegetation, ESA WorldCover, OpenStreetMap and flood hazard maps. Working step by step with Dar es Salaam as the worked example, participants build a ward data profile, map urban growth, heat and green space, access to health, schools and water, and the exposure of critical infrastructure to floods, then combine the evidence into a ward resilience profile with action priorities. Every lesson ends with a map and a plain-language interpretation of what it means for city decisions. The course is designed for municipal and local government planners, engineers, environment and disaster risk officers with basic QGIS skills, and is delivered as six contact-day practicals with step-by-step written guides.
COURSE
Mapping and Analysing Your City with QGIS, Global Open Data and the Climate Risk Database (CRD)
Taught by Msilikale Msilanga
Open to members of Ardhi University.
LESSONS
1
% complete
DURATION
~1 hr 21 min
Self-paced
STUDENTS
3
enrolled
CERTIFICATE
No
not offered for this course
About this course
Participants have better understanding of urban resilience, the shocks and stresses that affect Tanzanian cities, and how evidence from maps supports the UNDRR Ten Essentials
Participants have practical skills in finding, downloading and preparing data from the Climate Risk Database and open global sources for their city in QGIS
Participants have practical skills in mapping urban growth, urban heat and green infrastructure, access to essential services and the flood exposure of critical infrastructure at ward level
Participants have improved competences to combine indicators into a ward resilience profile, test its sensitivity and link the results to concrete action priorities
Course content
%
What learners say
Your instructor
Partners involved
Course details
Format
Self-paced
Language
English
Level
Advanced
Last updated
October 5, 2026
Certificate
Not included
Share this course
Help someone find this training.
Share…
Share on LinkedIn
Share on X
Share on Facebook
Share on WhatsApp
Share by email
Copy link