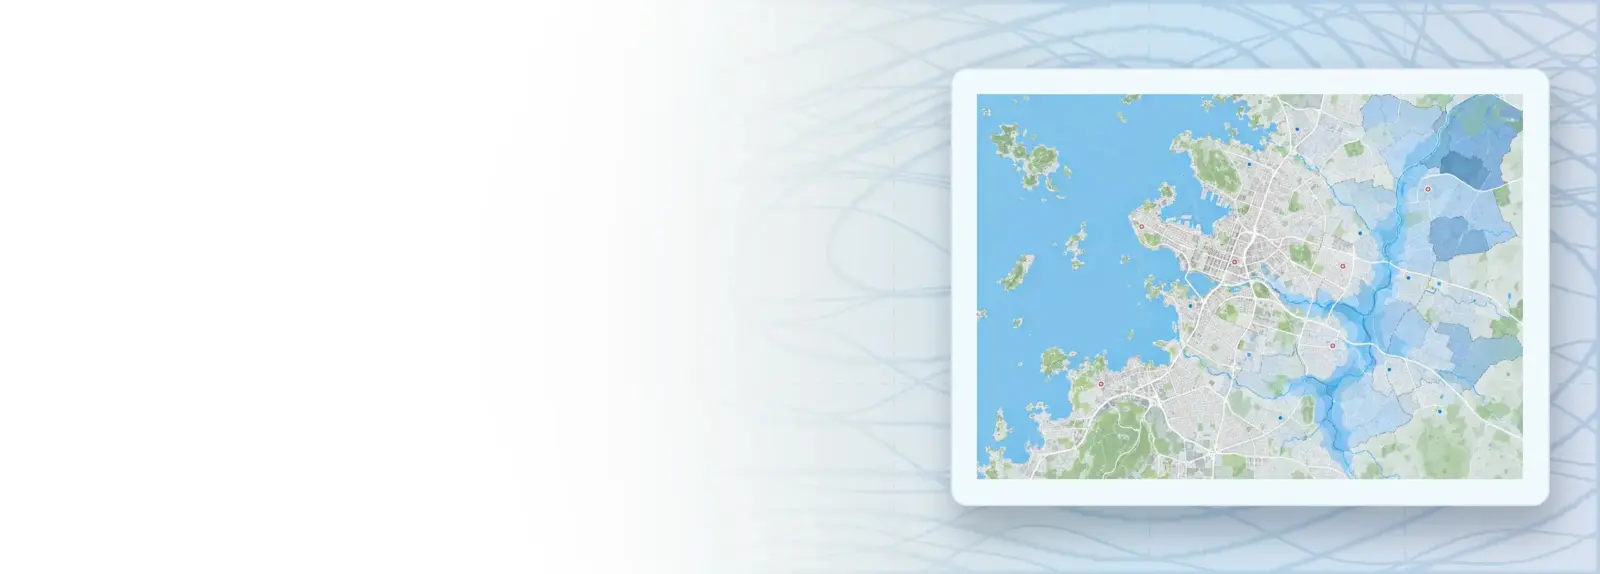
Tanzanian cities face floods, landslides, rockfall, drought and other climate hazards, and the decisions taken before, during and after a disaster depend on knowing where the hazard is and who and what is exposed. This course equips government officials to analyse and visualise geospatial data for those decisions. Starting from the original downloads of the Climate Risk Database and free national and global datasets, participants inspect, clean, clip and buffer the data in QGIS, map exposure, critical facilities, roads and drainage, set priorities, make finished maps, collect and map field reports, map flood extent from satellite radar, summarise damage and share the results, and prepare ward warning messages. The worked case is the very strong El Niño forecast by the Tanzania Meteorological Authority for the 2026 Vuli rains, with Mwanza as the example city; the same methods apply to other cities and other hazards. Participants work through 13 step-by-step practical guides in QGIS, KoboToolbox, Excel and web forecast tools, with notes to apply every step to any Tanzanian city. The course ends with each participant compiling a decision brief for the disaster management committee, in this case a City El Niño Preparedness Brief.
COURSE
Analysis and Visualisation of Geospatial Data for Decision Making: Preparing for, Responding to and Recovering from Disasters
Taught by Amedeus Raphael Kimaro & Msilikale Msilanga
LESSONS
13
% complete
DURATION
~27 hr 23 min
Self-paced
STUDENTS
5
enrolled
CERTIFICATE
Yes
on completion
About this course
Participants have better understanding of how seasonal forecasts and warnings are read and turned into early action triggers, with El Niño and the Vuli rains as the worked case
Participants have practical skills in getting raw flood hazard, population, building, facility, road and drainage data from the Climate Risk Database and global datasets, cleaning, clipping, buffering and analysing it in QGIS (including network analysis), and making styled, print-ready maps
Participants have improved competences to prepare ward risk maps and actionable warning messages, collect field reports and map flood extent from satellite radar
Participants have improved competences to assess damage and needs, share data and compile a city El Niño preparedness brief for decision makers
Course content
%
What learners say
Your instructor
Partners involved
Course details
Format
Self-paced
Language
English
Level
Intermediate
Last updated
October 18, 2026
Certificate
Included ✓
Share this course
Help someone find this training.
Share…
Share on LinkedIn
Share on X
Share on Facebook
Share on WhatsApp
Share by email
Copy link