
EXPLORE THE GALLERY
Data Visualization Catalogue
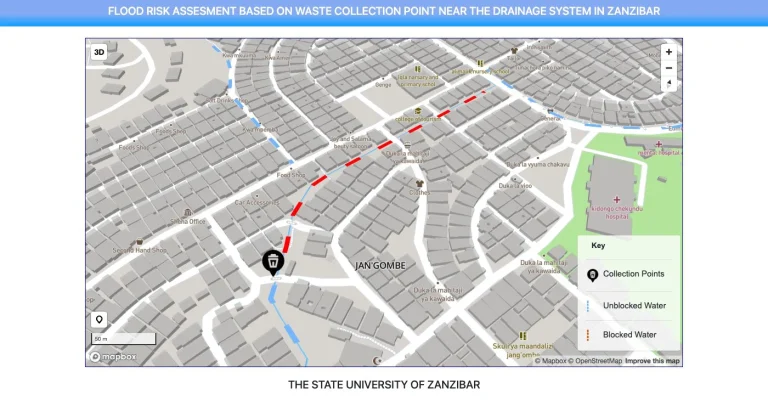
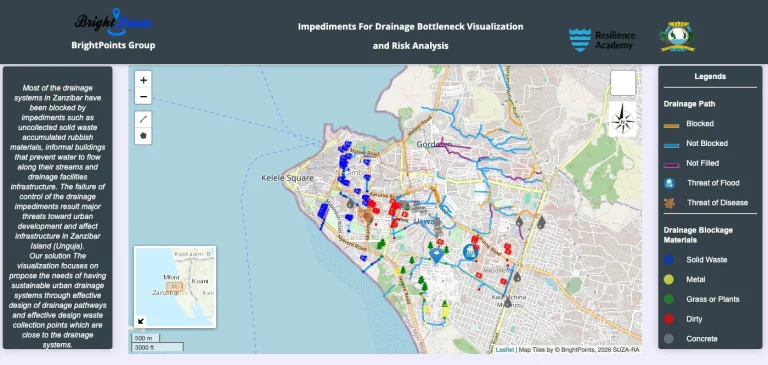
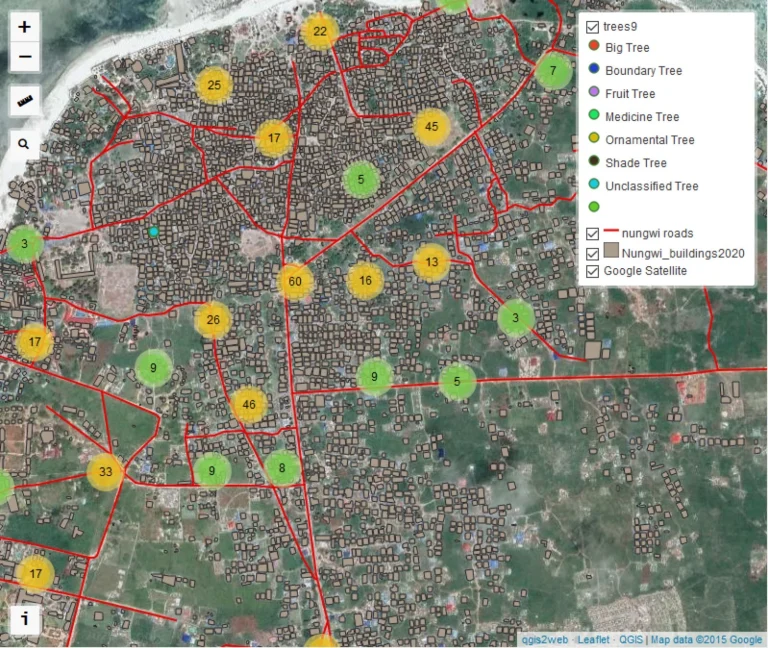
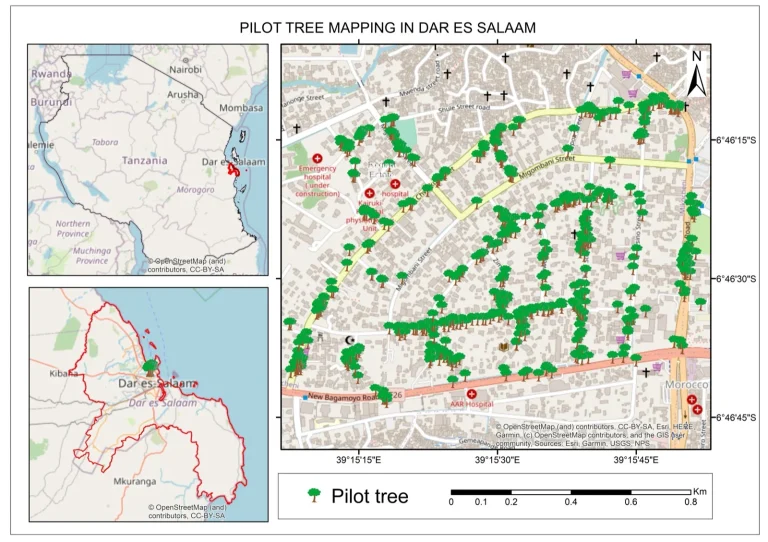
Every visualisation produced by students through the Resilience Academy Data Visualization Challenge — each one addressing a real urban resilience problem in a Tanzanian city, using open data and open-source geospatial tools.
32
Visualisations
4
Editions
511
Students engaged
7
Partner institutions
PARTNER WITH US
Have a data challenge for students?
Bring a real problem and a dataset, and a student team will turn it into a visualisation that supports a decision. Every solution in this catalogue started that way.