

Skip to content
← My Courses
Data Visualisation Challenge

COURSE

Data Visualisation Challenge

Beginner

~3 hr 11 min

Self-paced

11 lessons · 2 videos, 3 readings, 4 slidess, 2 practicals · ~3 hr 11 min

Taught by Raya Idrissa Ahmada, Dr. Mahadia Tunga, Dr. Zakaria Ngereja, Dr. Wulystan Mtega & Harun Makandi

LESSONS

11

% complete

DURATION

~3 hr 11 min

Self-paced

STUDENTS

0

enrolled

CERTIFICATE

No

not offered for this course

About this course

Data visualisation challenge gives an opportunity for university students to learn geospatial data visualisation techniques in practice when they take part as a group into a competition, where teams create real-world data visualisation solutions based on TURP community needs and established cases. The learning process is mainly of-campus, based on teams working and seeking for advice and mentoring support from the universities’ experts.

A major part of the challenge has been a face-to-face gathering of the team, which COVID-19 prohibits partially since the COVID-19 restrictions began. Since 1st June 2020, in Tanzania, there were no restrictions for COVID-19 when the government opened the Universities. However, we would like to use this opportunity for 2020 visualisation challenge to be coordinated in an online platform which we developed to be used during COVID-19 period.

Background

Tanzanian cities are vulnerable to floods and climate change impacts due to rapid and uncontrolled urban growth and insufficient urban planning. Digital (spatial) data can provide valuable insights and evidence on how cities can be planned, lived and developed in a more resilient manner. This competition aims at finding data visualisation solutions, which increase understanding of resilient urban development in Tanzania.

All information about the challenge: https://resilienceacademy.ac.tz/dataviz-announcement-2020/

Data repository: https://crd.resilienceacademy.ac.tz/
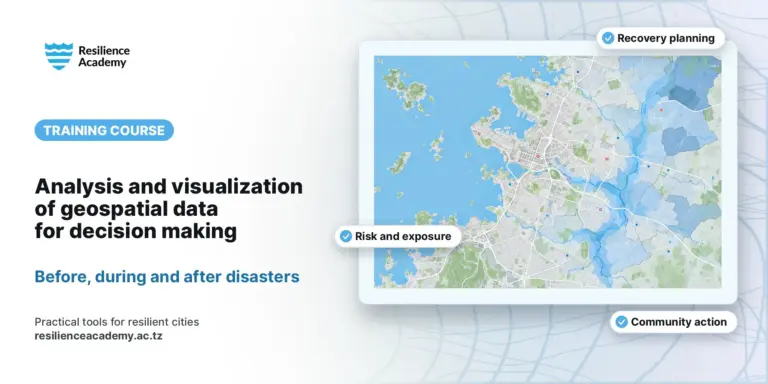
Students learn to apply data visualisation skills via a Data Visualisation Challenge

Students have practical data visualisation skills

Students have obtained valuable links to end-users

Course content

11 lessons

%

Data Visualisation Challenge topics 2020

Reading

Background material for Data Visualisation Challenge

Slides

Visualisation inspiration and tools

Slides

Examples 1: using QGIS

Practical · hands-on

Examples 2: visualisation with web-based services

Reading

Examples 3: Python libraries

Slides

How to get started?

Slides

Important info: Next submission deadline 31st October 23:59

Practical · hands-on

Webinar 21.10.2020

Video

More information and links

Reading

Sign in to access full course content

What learners say

Your instructor

Instructor
Instructor
Instructor
Instructor
Harun MakandiSupporter

Partners involved

Course details

Format

Self-paced

Language

English

Level

Beginner

Last updated

September 1, 2026

Certificate

Not included

Share this course

Help someone find this training.

Share…

Share on LinkedIn

Share on X

Share on Facebook

Share on WhatsApp

Share by email

Copy link

More like this